
The summer of 2025 made it clear that Europe is experiencing an increasing number of days with extreme temperatures. Heatwaves occurred throughout June, July and August, and this pattern is not unique to Europe. According to recent data, extreme heat is already having serious health consequences on a global scale. In this context, any tool that helps us to understand the impact of temperature on our environment and well-being is especially useful.
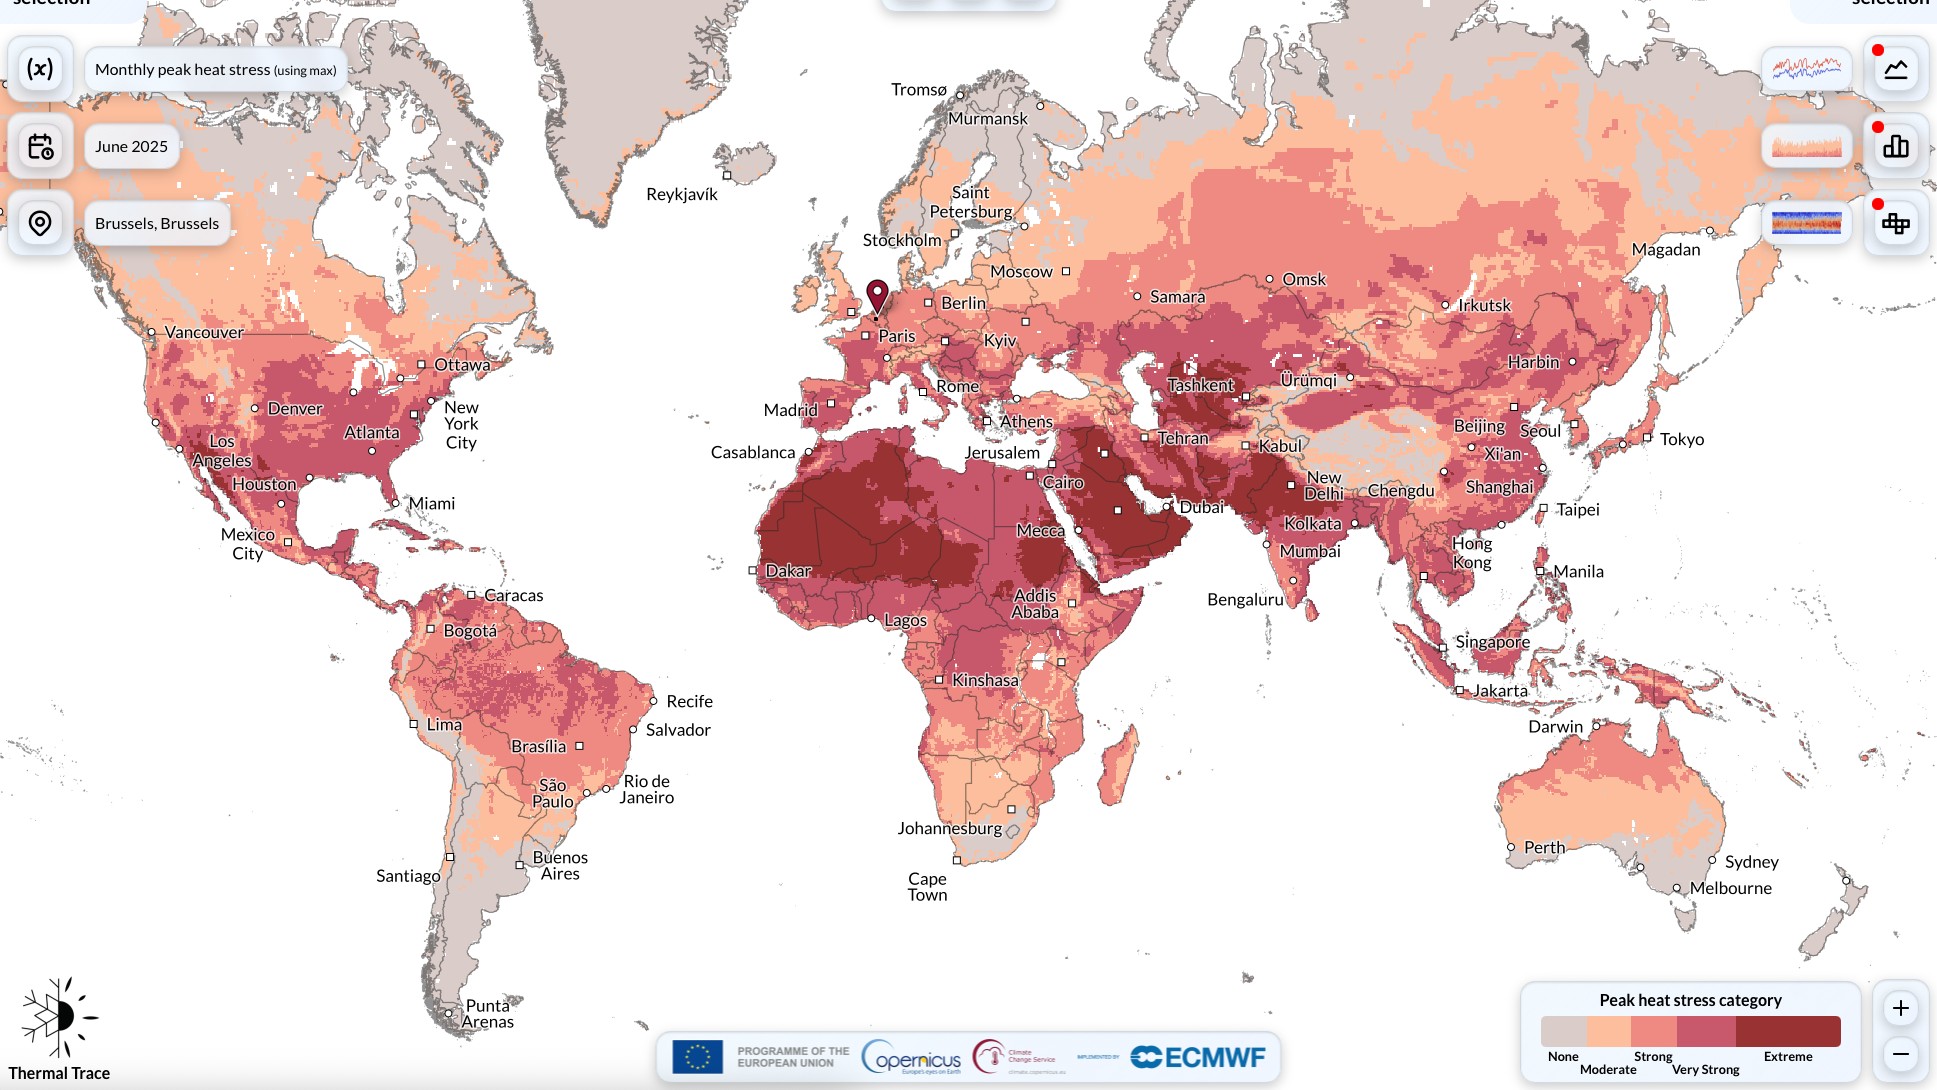
The Copernicus Climate Change Service has launched Thermal Trace, a web application that transforms over 80 years of climate data into easy-to-interpret maps and graphs. It aims to help citizens, professionals and public officials visualise heat and cold stress in near real time and compare this data with trends over the last few decades.
Users can explore how thermal events have evolved anywhere on the planet, from recent heat or cold peaks to seasonal and annual patterns. Simply select a location on the map or type in its name to access time series, heat maps or thermal comfort indicators, such as the number of tropical nights or days with cold stress. All information can be downloaded for use in studies.
Although Thermal Trace does not offer weather warnings or forecasts, it provides an accessible, visual resource for understanding trends that directly affect health, urban planning, mobility and emergency management. In an era where the climate is increasingly influencing our activities, access to clear, easily consultable data is a crucial step in anticipating impacts and designing more effective responses.
Here at Sevilla Capital Española, we continue to monitor technological initiatives like this, which, despite focusing on the Earth’s climate, demonstrate how observing the planet from space and analysing large amounts of data can improve everyday life and help us prepare for future challenges.